In 2019 the UK saw a further slowing down in the annual growth in house prices following 2018’s weakest growth since 2013.
According to HM Land Registry, annual growth in house prices in all countries of the UK, England, Scotland, Wales and Northern Ireland, weakened in 2019 compared with 2018.
Annual house price growth (%), countries of the UK, 2013 to 2019
| United Kingdom | England | Scotland | Wales | Northern Ireland | |
| 2013 | 2.6 | 2.9 | 0.4 | 0.4 | -2.8 |
| 2014 | 8.0 | 8.3 | 4.7 | 5.0 | 7.7 |
| 2015 | 6.0 | 6.8 | 4.0 | 2.8 | 7.3 |
| 2016 | 7.0 | 7.7 | 1.4 | 4.2 | 6.5 |
| 2017 | 4.5 | 4.8 | 2.9 | 4.3 | 3.8 |
| 2018 | 3.3 | 3.0 | 4.6 | 4.8 | 4.6 |
| 2019 | 1.3 | 1.0 | 1.8 | 4.0 | 3.5 |
All regions in England experienced a slowdown between 2018 and 2019, but this weakening growth was more evident in London and the South East of England with house prices falling over the year in 2019.
Annual house price growth (%), by English region, 2018 and 2019
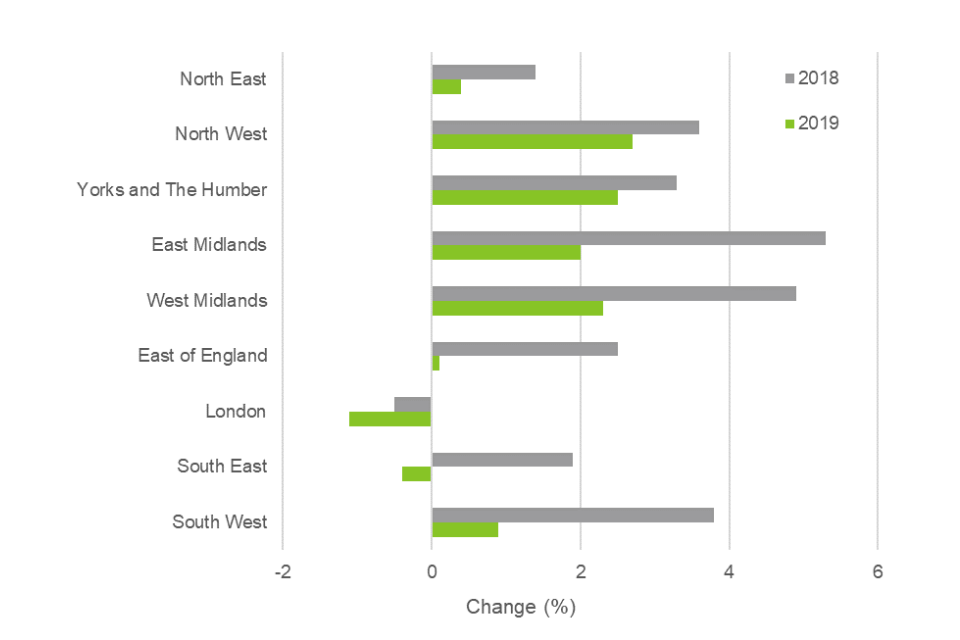
Source: HM Land Registry
North Devon in England showed the strongest growth among local authorities, with an 8.9% annual growth in house prices. There was notable growth across several local authorities in South Wales, particularly near to the M4 corridor connecting Bristol to Newport. This could be a continuation of the impact of the abolition of the Severn Bridge tolls making it more affordable for those who work in Bristol to live on the Welsh side of the River Severn.
Top 5 UK local authorities, by annual growth in 2019
| Local authority | Average price (£) | Annual growth (%) |
| North Devon | 247,590 | 8.9 |
| Blaenau Gwent | 93,046 | 7.8 |
| Monmouthshire | 273,209 | 6.8 |
| Merthyr Tydfil | 107,891 | 6.6 |
| Rochdale | 141,397 | 6 |
As with 2018, London boroughs dominate the local areas where prices have fallen the most over the year. This performance in London follows a general slowdown in the London property market since mid-2016 and is probably due to the area being disproportionately affected by regulatory and tax changes.
Bottom 5 UK local authorities, by annual growth in 2019
| Local authority | Average price (£) | Annual growth (%) |
| Kensington and Chelsea | 1,256,713 | -7.7 |
| City of Aberdeen | 148,668 | -6.2 |
| City of Westminster | 956,750 | -5.9 |
| Tandridge | 439,765 | -4.0 |
| Cherwell | 283,742 | -3.9 |
Note: The figures in this story are annual estimates and will therefore show different annual growth rates and average prices to our monthly statistics. Low number of sales transactions in some local authorities and London boroughs (such as Orkney Islands, Na h-Eileanan Siar, Shetland Islands and City of London) can lead to volatility at these levels (geographies with low number of sales transactions should be analysed in the context of their longer-term trends rather than focusing on monthly movements).
Image: Kensington, London, UK / REET